Engineering readiness
For engineering managers 3 min read
Readiness across all your engineers: who's ready, who's ramping, who's blocked, and where journeys stall.
Engineering readiness rolls every knowledge journey up into one view. It's a decision from mandatory gates, not an average.
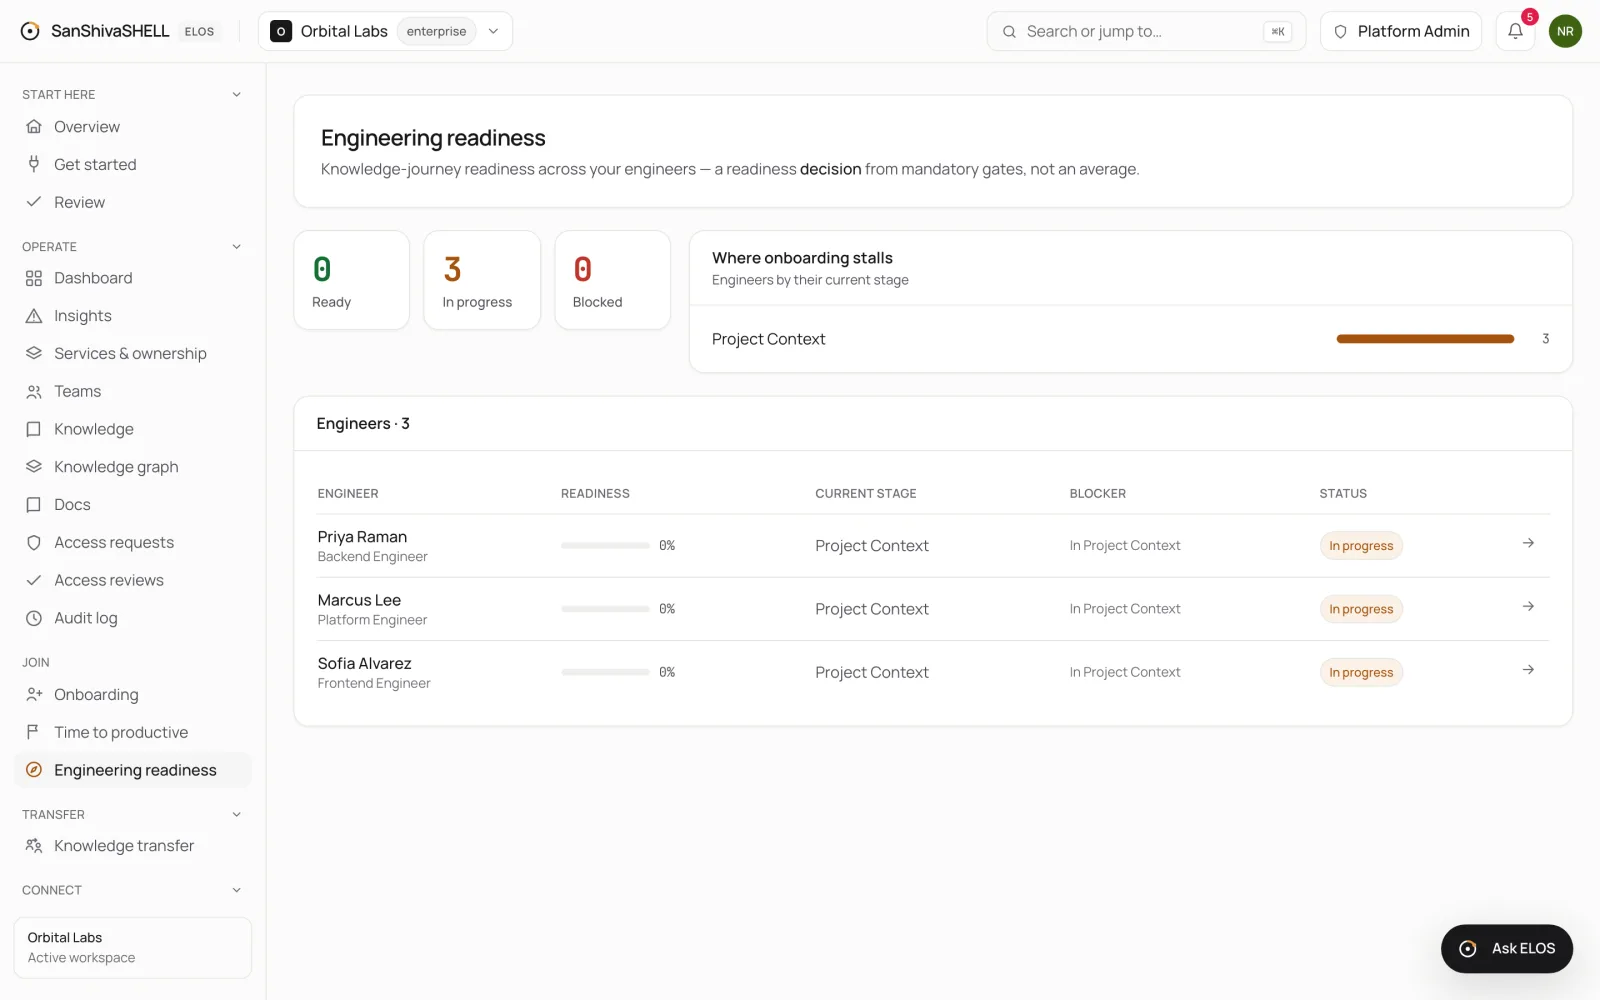
- Ready, In progress and Blocked count your engineers by status.
- Where onboarding stalls shows how many engineers are at each stage, so you can see a stage that holds people up.
- The Engineers table shows each person's readiness, current stage, blocker and status. Select a row to open their journey.
What's next
- Time to productive: How fast joiners go from their first day to delivering, measured from real onboarding, access and ownership state.