Find your way around
For administrators, engineering managers, engineers, security and compliance 4 min read
The sidebar, the dashboard, search, notifications and the Ask ELOS button that's on every page.
The sidebar
The sidebar groups pages by what you're doing. What you see depends on your role: a page you don't have permission for isn't shown.
| Group | Pages |
|---|---|
| Start here | Overview, Get started |
| Operate | Dashboard, Insights, Services & ownership, Knowledge, Docs, Access requests, Access reviews, Audit log |
| Join | Onboarding, Time to productive, Engineering readiness |
| Connect | Integrations |
| Administer | Members, Settings, Roles & permissions, Service accounts, Security & trust |
The dashboard
Dashboard is the health of your workspace at a glance: onboarding velocity, access risk, ownership coverage and reliability, a trust bar with the state of sign-in, the audit trail and data protection, and the lifecycle as live counts for each pillar.
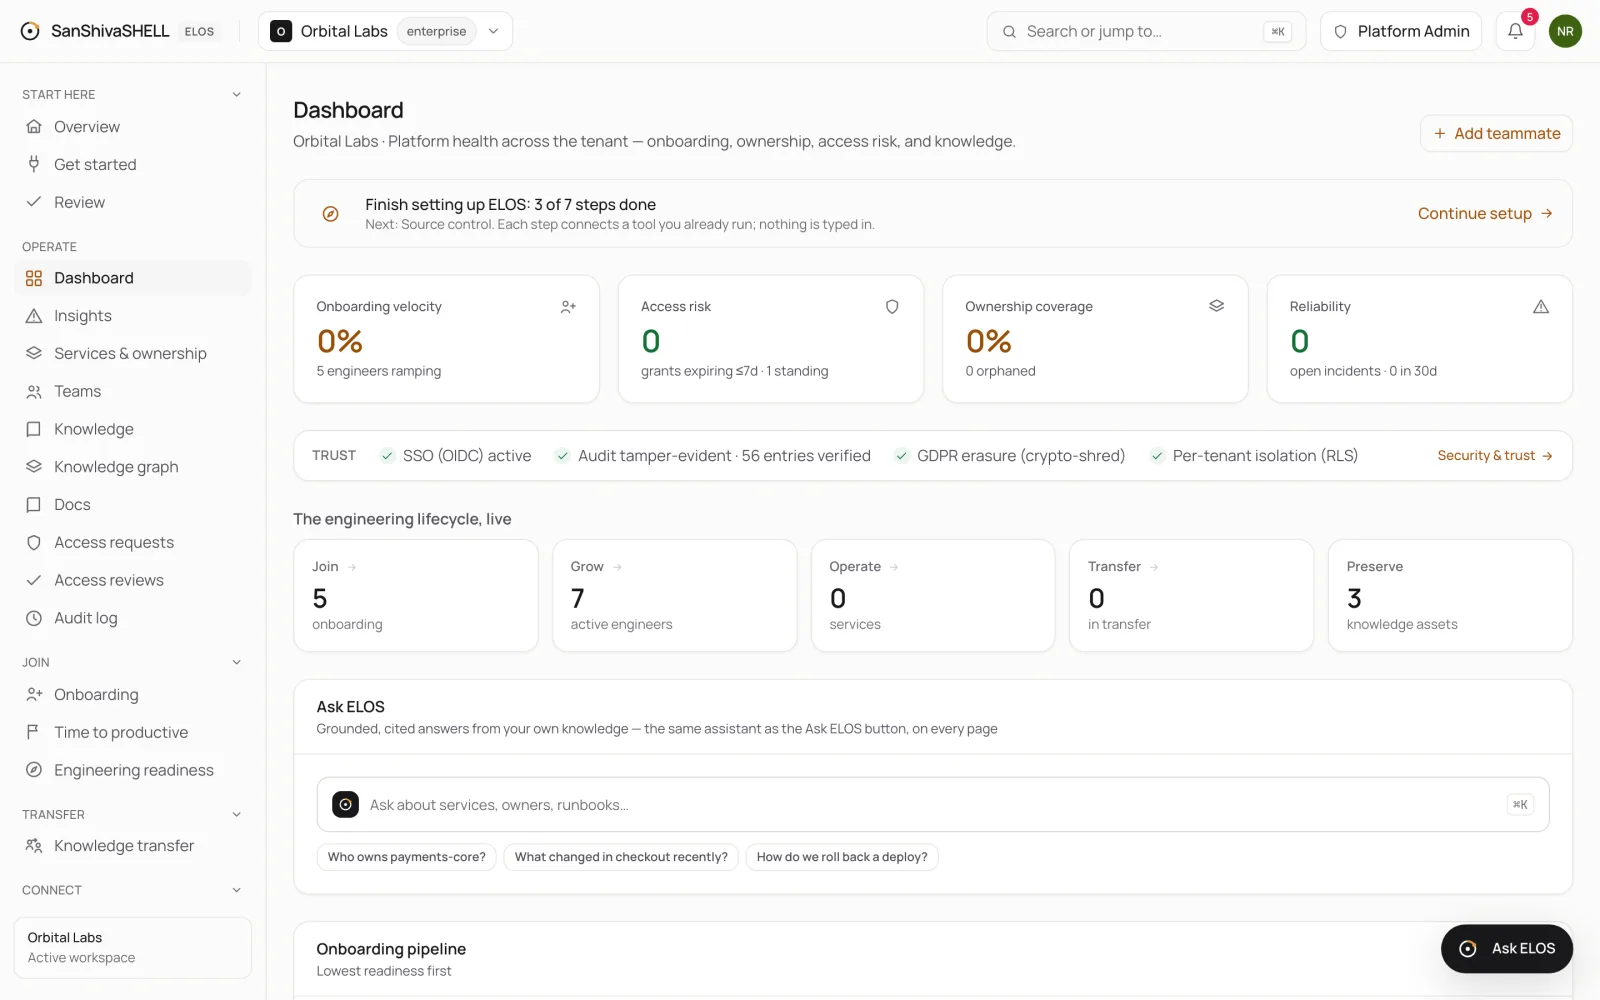
The trust bar only reports what it can verify. For example, Audit tamper-evident shows how many audit entries were just verified against the hash chain.
Search, notifications and your profile
- Search or jump to (or press ⌘K / Ctrl+K) jumps to a page, a person or a service, or sends your question straight to Ask ELOS.
- The bell shows your notifications.
- Your initials open your profile: your identity, your access role and the permissions it grants.
Ask ELOS
The Ask ELOS button in the bottom corner of every page opens the assistant. It answers from your organization's own knowledge and cites its sources. See Ask ELOS.
What's next
- Connect your tools: Connect identity, source control, cloud and other systems. Each credential is verified with the provider before it's trusted.